
US Solar Module Efficiency Benchmark 2026
TOPCon, HJT and PERC compared across leading manufacturers serving the US commercial and utility-scale market — datasheet metrics, independent test evidence and what they mean for energy yield
Prepared for procurement officers, EPC executives, project engineers and asset owners. This guide does not constitute legal, tax, or investment advice. Readers should consult qualified counsel before making decisions based on this analysis.
Part IExecutive Summary
Module efficiency is the most quoted number on a datasheet and one of the least understood. This benchmark sets out the published datasheet metrics for 30 module families from 17 manufacturers that supply the US commercial and utility-scale market. It sets them beside independent test evidence from Kiwa PVEL, RETC, Fraunhofer ISE, ITRPV and NLR (formerly NREL). The aim is a single, sourced reference that procurement and engineering teams can use to separate what changes energy yield from what changes only the nameplate.
Every datasheet value in this guide was read directly from the manufacturer's document. Where a sheet does not print a value, we say so and do not fill the gap from reseller listings. Where SolarStock USA Research has computed a figure, such as an end-of-warranty value or an illustrative energy delta, it is labelled as computed or Illustrative and every assumption is shown. Nothing here ranks brands. Datasheets describe the best case a manufacturer is prepared to warrant. They are not a measured comparison under identical conditions, and the guide treats them that way.
Conclusions
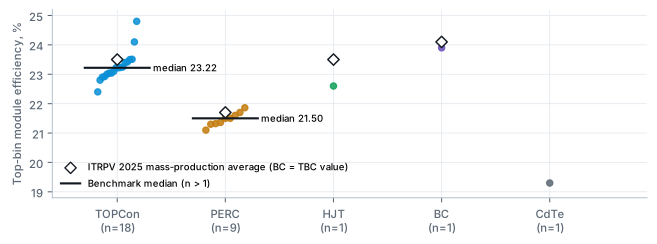
- TOPCon is now the reference technology, and its efficiency advantage over PERC is about 1.7 points. The 18 TOPCon-class products in our set have a median top-bin efficiency of 23.22% (range 22.40–24.80%). The nine PERC products have a median of 21.50% (21.10–21.86%). The gap of roughly 1.7 percentage points means about 8% more watts per square metre of module. ITRPV's 2025 mass-production averages show the same pattern: 23.5% for TOPCon and 21.7% for PERC.
- PERC is in managed decline, but it has not disappeared from US supply. ITRPV puts PERC at roughly 14% of 2025 cell output and expects it to leave the market within ten years. In the US, PERC remains on current datasheets from several manufacturers, including a number of US-assembled lines. Buyers will continue to see PERC alongside TOPCon in 2026 tenders and should compare the two on energy and warranty terms, not on wattage.
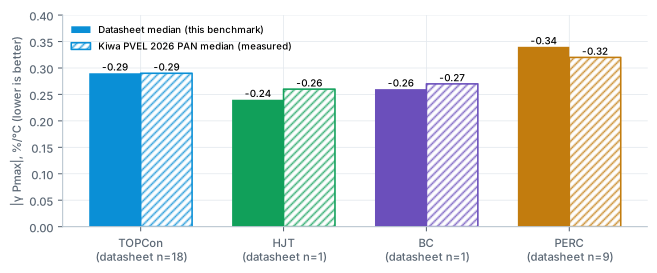
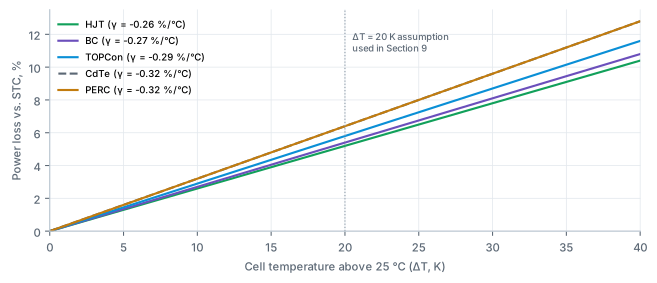
- Temperature coefficient favours n-type technologies, and the independent data agree with the datasheets. The datasheet median for γPmax is −0.29%/°C for TOPCon against −0.34%/°C for PERC. Kiwa PVEL's 2026 PAN-file medians, measured on 2023–2025 bills of materials, are −0.29 (TOPCon), −0.26 (HJT), −0.27 (back contact) and −0.32%/°C (PERC). In hot US climates, the TOPCon–PERC difference is worth roughly 0.6–1.0 percentage points of output at a 20 K cell-temperature excess, depending on whether measured or datasheet values are used (Sections 5 and 10).
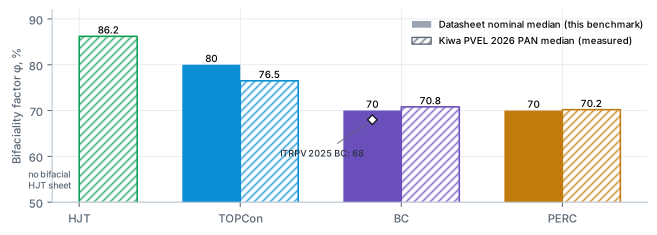
- Measured bifaciality runs HJT > TOPCon > back contact ≈ PERC, and TOPCon measures below its datasheet nominal. TOPCon datasheets cluster at a nominal 80% (with ±5–10% tolerance). Kiwa PVEL's measured median is 76.5%, against 86.2% for HJT, 70.8% for back contact and 70.2% for PERC. Energy models should use the measured PAN value for the specific bill of materials, not the headline number.
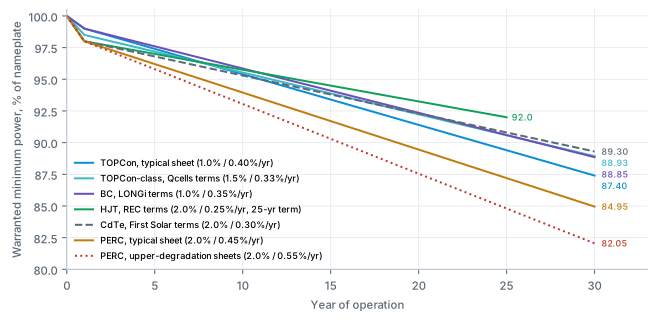
- Warranty terms reward n-type, and they diverge more than efficiency does over 30 years. A typical TOPCon sheet warrants 1.0% first-year loss and 0.40% per year, which gives 87.4% at year 30. A typical PERC sheet warrants 2.0% and 0.45–0.55% per year, which gives 82.1–84.95%. Averaged over 30 years, the warranted floor is about 93.2% for TOPCon and 91.5% for PERC.
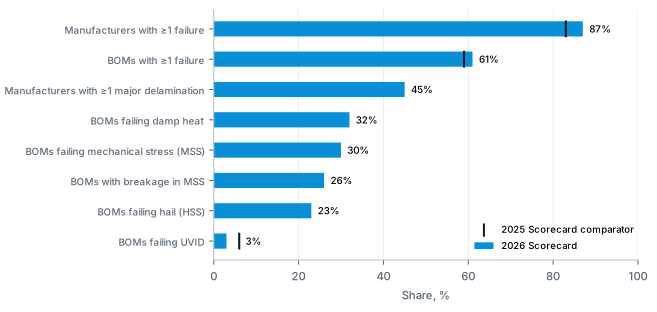
- Reliability risk is rising faster than efficiency. In Kiwa PVEL's 2026 Scorecard, 87% of manufacturers and 61% of bills of materials had at least one test failure, both record highs. For the first time, no single bill of materials was a Top Performer in every test. RETC's 2026 PV Module Index reports damp-heat failures up from 6% to 11% and UV-induced degradation (UVID) failures at 8%.
- TOPCon's UV sensitivity has improved but is not solved. The Kiwa PVEL median UVID loss for TOPCon fell from 4.2% to 3.0%, and UVID failures fell from 6% to 3% of bills of materials. Individual results still vary widely: one spotlighted bill of materials lost 14.1%. Fraunhofer ISE has shown that standard UV tests can overstate the persistent field loss, which makes stabilised, like-for-like test data essential.
- A datasheet efficiency figure is not a measure of bankability. Two modules with identical efficiency can differ in temperature behaviour, bifaciality, warranty floor, test history and domestic-content value. Procurement decisions should weight PAN-file performance, independent reliability results, warranty terms and supply-chain documentation alongside efficiency (Section 11).
- Heterojunction remains a thin US option. Meyer Burger's US module plant in Goodyear, Arizona ceased production in mid-2025, when its German subsidiaries filed for insolvency. The only HJT product in this benchmark is a residential reference model. HJT's measured thermal and bifacial advantages are real, but buyers have few utility-format HJT choices in the current US market.
At a glance
| Technology | Models (n) | Median top-bin efficiency (range), % | γPmax %/°C: datasheet median / PVEL 2026 | Bifaciality %: datasheet nominal / PVEL measured | Typical warranty: yr-1 / annual / yr-30 | 2025 production share (ITRPV / ISE) |
|---|---|---|---|---|---|---|
| TOPCon (incl. N-type unconfirmed) | 18 | 23.22 (22.40–24.80) | −0.29 / −0.29 | 80 / 76.5 | 1.0% / 0.40% / 87.4% | Dominant (ITRPV, chart); PERC ≈14% |
| PERC | 9 | 21.50 (21.10–21.86) | −0.34 / −0.32 | 70 / 70.2 | 2.0% / 0.45% / 84.95% | ~14% of cell market |
| HJT | 1* | 22.60 | −0.24 / −0.26 | monofacial ref. / 86.2 | 2.0% / 0.25% / 92% at yr 25 | Not stated in text |
| Back contact | 1* | 23.90 | −0.26 / −0.27 | 70 / 70.8 (ITRPV: 68) | 1.0% / 0.35% / 88.85% | Not stated; up to 28% within a decade |
| CdTe (thin film) | 1* | 19.30 | −0.32 / n/a | monofacial | 2.0% / 0.30% / 89.3% | 16 of 706 GWp thin film (ISE, First Solar only) |
Datasheets listed in Section 13 (medians computed by SolarStock USA Research); Kiwa PVEL 2026 PAN performance medians (2023–2025 BOMs); ITRPV 17th edition (VDMA, June 2026); Fraunhofer ISE Photovoltaics Report (14 July 2026). *A single product, so the figure describes that model, not the technology. Year-30 values are computed from printed first-year and annual terms.
How to use this guide
Section 3 holds the full datasheet tables. Sections 4–7 explain each metric and what it does to energy yield. Section 8 summarises the independent reliability evidence, and Section 10 converts the differences into illustrative energy figures for a 1 MWdc array in a hot US climate. Section 11 is a checklist of documents to request before an award. Readers who need only the numbers can go directly to Tables 3.1–3.3.
Section 1Scope and Methodology
The benchmark covers crystalline-silicon and thin-film modules in the commercial and utility-scale power classes that are marketed to US buyers in 2025–2026, plus one residential HJT reference. It compares the products on what their own datasheets print, and then tests those claims against independent evidence.
1.1 How models were selected
The set was assembled to represent the module families a US procurement team is most likely to see in a 2026 commercial or utility tender. It has four components:
- Large global suppliers with established US channels, including JA Solar, Jinko Solar, LONGi, Trina Solar, Canadian Solar and Qcells.
- Manufacturers active in US distribution and inventory channels, including Sunpro Power, ZN Shine, Waaree, Talesun and Boviet Solar.
- US-assembled and US-manufactured lines from Mission Solar, Silfab, Heliene, Illuminate USA, Canadian Solar (Texas-assembled version), Boviet and First Solar.
- Technology references, so that every architecture discussed is represented by at least one current datasheet: an HJT product (REC Alpha Pure-RX), a back-contact product (LONGi Hi-MO X10 Explorer) and a CdTe thin-film product (First Solar Series 7 TR1).
Where a manufacturer offers both PERC and n-type lines, both were included when a current datasheet was available. The aim was to show the technology transition within the same supplier. Inclusion does not imply any commercial relationship or endorsement, and exclusion does not imply any judgement. Some requested models could not be included because no primary datasheet was obtainable: a US-specific 144-cell Jinko Tiger Neo sheet, the LONGi Hi-MO 9 and the current bifacial Trina Vertex N. Meyer Burger is excluded because its US module plant ceased production in 2025 (Section 12). T1 Energy has no public module datasheet.
1.2 Datasheet sources and version rules
Sources were used in this order of preference:
- a PDF hosted by the manufacturer;
- a manufacturer datasheet stored by SolarStock USA for its own listings, read directly;
- a manufacturer datasheet hosted by a distributor or reseller.
For each product we used the most recent version we could obtain and recorded its version code or date (Table 3.4). Version matters. Several manufacturers changed power bins, bifaciality statements or wording about cell architecture between versions in 2024–2026. A value that holds on one sheet may not hold on the version attached to a purchase order. Values were taken as printed. Where a sheet gives only the year-1 and year-30 warranty end-points, we derived the annual degradation rate as (year-1 % − year-30 %) / 29 and marked it as derived.
1.3 "Best bin" definition
Most datasheets print a family of power bins, for example 585, 590, 595 and 600 W, each with its own efficiency. In this guide "top-bin efficiency" is the efficiency printed for the highest power bin on the sheet. We also show the full bin range, because a buyer ordering a mid-range bin will receive a lower efficiency than the headline. On one sheet in the set, the spread between the lowest and highest bin is more than 1.5 percentage points. The datasheet efficiency is defined, as ITRPV notes, as label power divided by module area times 1,000 W/m². It therefore inherits the power tolerance printed on the sheet, which is typically 0 to +3% or 0 to +5 W, or ±3% for measurement.
1.4 Technology classification and the "N-type (unconfirmed TOPCon)" flag
Not every n-type datasheet names its cell architecture. Several current sheets print only "N-type" or "N-type mono", or use a proprietary cell brand. Where the sheet itself names TOPCon, the product is classified TOPCon. Where the sheet says only "N-type", the product is classified N-type (unconfirmed TOPCon). It is grouped with TOPCon in medians and charts because its printed temperature coefficient, bifaciality and warranty terms are consistent with TOPCon, and because other documents from the same manufacturer or family point that way. Readers should treat these as provisional until the manufacturer confirms the architecture in writing.
The flag applies to nine of the 18 TOPCon-class rows: three Sunpro Power families, the JA Solar DeepBlue 4.0 Pro, the Qcells Q.TRON, two Silfab models, the Heliene NTYP and the Talesun TM7G72M. Restricting the TOPCon group to the nine sheets that name the architecture barely changes the result: the median top-bin efficiency moves from 23.22% to 23.25%. Similarly, the two Illuminate USA sheets describe gallium-doped p-type cells but do not print "PERC". They are labelled PERC (inferred). The JA Solar JAM72D30 is classified as PERC because its datasheet explicitly describes a bifacial mono PERC module (DeepBlue 3.0).
1.5 What datasheets cannot tell you
A datasheet is a manufacturer's statement of rated performance under Standard Test Conditions (1,000 W/m², 25 °C cell, AM1.5), not a measurement of the modules delivered. Power tolerances and measurement uncertainty, typically ±3%, are of the same order as many differences between products. NOCT and NMOT are defined differently across sheets. Bifaciality is printed as a nominal value with a wide tolerance band. Warranty terms are commercial commitments whose value depends on the warrantor's continuity.
For these reasons, Sections 5–8 pair each datasheet metric with independent measured data where it exists.
Section 2Technology Primer
Five cell technologies appear in the benchmark. Four are crystalline silicon and differ mainly in how they passivate the cell surfaces and where they place the contacts. The fifth, cadmium telluride, is a thin-film technology with different physics and a single large-scale producer.
2.1 PERC (Passivated Emitter and Rear Cell)
PERC adds a passivating dielectric layer to the rear of a conventional p-type cell and opens it locally for the metal contact. It was the dominant technology for most of the past decade and is mature, low-cost and well characterised in the field. Its limits are physical. ITRPV reports an average PERC module efficiency of 21.7% in 2025 and does not expect the average to exceed 22.1%. PERC's temperature coefficient (around −0.32 to −0.36%/°C on datasheets) and bifaciality (around 70%) are the weakest of the silicon technologies. Modern PERC lines generally use gallium-doped wafers, which mitigate the light-induced degradation that affected earlier boron-doped p-type cells.
2.2 TOPCon (Tunnel Oxide Passivated Contact)
TOPCon uses an n-type wafer with an ultra-thin tunnel oxide and a doped polysilicon layer on the rear, which passivates the contact itself. It can be built on upgraded PERC production lines, which explains its rapid rise. ITRPV reports that TOPCon overtook PERC in 2024 and expects it to remain at around half the market in a decade. The 2025 mass-production average module efficiency is 23.5%, rising to an expected 25.2%. Compared with PERC it offers higher efficiency, a better temperature coefficient (around −0.29%/°C) and higher bifaciality (nominally 80%). Its known weak points are sensitivity to UV exposure and, in accelerated tests, to moisture-driven corrosion of the front-side metallisation (Section 8).
2.3 HJT (Silicon Heterojunction, SHJ)
Heterojunction cells sandwich an n-type crystalline wafer between thin amorphous-silicon layers. The structure gives excellent surface passivation, a high open-circuit voltage and a symmetrical cell. In practice that means the lowest temperature coefficients among silicon technologies and the highest bifaciality. Kiwa PVEL measures a median of 86.2% bifaciality, and ITRPV expects HJT to move above 90%. ITRPV reports a 2025 average HJT module efficiency of 23.5%, the same as TOPCon. HJT needs dedicated low-temperature production equipment, which has limited its scale outside a few manufacturers.
2.4 Back contact (IBC, TBC, HBC; collectively xBC)
Back-contact cells move all metal contacts to the rear, which removes front-side shading. TBC combines this with TOPCon-style passivating contacts, and HBC combines it with heterojunction contacts. LONGi's HPBC products belong to this family. ITRPV reports the highest 2025 average module efficiencies here, 24.1% for TBC and 24.4% for HBC, and expects 25.6% and 26.3% by 2036. Back-contact modules have the lowest bifaciality of the silicon technologies today: 68% on ITRPV's 2025 figure and 70.8% on the Kiwa PVEL median. ITRPV expects back contact to reach up to 28% market share within a decade.
2.5 CdTe thin film (reference)
Cadmium telluride modules are deposited as thin films on glass rather than built from wafers. They operate on different physics: their temperature coefficient is moderate (−0.32%/°C on the First Solar Series 7 sheet) and their spectral response differs from silicon. Datasheet efficiency is lower: 19.3% top bin in our set, and Fraunhofer ISE reports CdTe module efficiency at almost 20%. Fraunhofer ISE counts 16 GWp of thin-film production in 2025 out of 706 GWp in total, and considers only First Solar in that figure. CdTe is included as a reference point because it is a significant US-manufactured technology in utility-scale procurement.
2.6 Wafer and module formats
Efficiency should not be confused with format. The benchmark spans M10 (182 × 182 mm wafers, typically 2278 × 1134 mm modules at 144 half-cells), M10R and G12R / 210R rectangular wafers (2382–2465 mm modules), and G12-class modules up to 2384 × 1303 mm. ITRPV cautions that comparing module types by label power alone can mislead, because label power scales with area. A 730 W module is not more efficient than a 600 W module simply because its wattage is higher. Efficiency, the label power per unit area, is the comparable metric.
| Technology | Wafer | Contact / passivation concept | ITRPV 2025 avg. module eff. | ITRPV expected 2036 | Key watch-points |
|---|---|---|---|---|---|
| PERC | p-type | Rear dielectric passivation, local contacts | 21.7% | ≤22.1% | Higher temperature loss; lower bifaciality; being phased out |
| TOPCon | n-type | Tunnel oxide + doped poly-Si contact | 23.5% | 25.2% | UVID; metallisation corrosion in damp heat |
| HJT (SHJ) | n-type | Amorphous-Si heterojunction, both sides | 23.5% | 24.9% | Limited US supply; specialised production |
| TBC | n-type | All-rear contacts, TOPCon-style | 24.1% | 25.6% | Lower bifaciality today |
| HBC | n-type | All-rear contacts, heterojunction | 24.4% | 26.3% | Lower bifaciality today |
| CdTe | thin film | Thin-film deposition on glass | — | — | Single dominant producer; monofacial |
ITRPV 17th edition (VDMA, June 2026), module efficiency in mass production (Fig. 55 and text); Fraunhofer ISE Photovoltaics Report (July 2026).
Section 3The Datasheet Benchmark
The tables below list all 30 module families, grouped by technology and sorted by top-bin efficiency within each group. All values are as printed on the datasheet version shown in Table 3.4, unless marked as derived or computed.
3.1 TOPCon and N-type (unconfirmed TOPCon) products
| Manufacturer · model | Technology | Cells · format | Power W | Top-bin eff. % | Bin range % | γ %/°C | Bifaciality % | Deg. yr-1 / annual % | Warranty term · end‡ |
|---|---|---|---|---|---|---|---|---|---|
| Jinko Solar Tiger Neo 3.0 66QL6-BDV 650–670 | TOPCon | 264 (¼-cut) G12R-class | 650–670 | 24.80 | 24.06–24.80 | -0.26 | 85 ±5 | 1.0 / 0.35 | 30 y 88.8% |
| Trina Solar Vertex N TSM-NE19R 615–650 | TOPCon | 132 210R | 615–650 | 24.10 | 22.8–24.10 | -0.29 | Monofacial | 1.0 / 0.40 | 25 y 89.4% |
| Sunpro Power SPDG620–635-N132R12 | N-type (unconf.) | 132 G12R | 620–635 | 23.51 | 22.95–23.51 | -0.30 | Not stated¹ | 1.0 / 0.40† | 30 y 87.4% |
| Canadian Solar TOPBiHiKu7 CS7N-695–730TB-AG (TX) | TOPCon | 132 G12-class | 695–730 | 23.50 | 22.4–23.50 | -0.29 | 80 | 1.0 / 0.40 | 30 y 87.4% |
| ZN Shine ZXM7-UHLDD144 575–605 | TOPCon | 144 M10 | 575–605 | 23.42 | 22.26–23.42 | -0.30 | 80 ±10 | 1.0 / 0.40 | 30 y 87.4% |
| Talesun BIPRO TM7G72M 585–605 | N-type (unconf.) | 144 M10* | 585–605 | 23.40 | 22.60–23.40 | -0.29 | 80 ±5 | 1.0 / 0.40 | 30 y 87.4% |
| Jinko Solar Tiger Neo 78HL4-BDV 625–650 | TOPCon | 156 M10-class | 625–650 | 23.25 | 22.36–23.25 | -0.29 | 80 ±5 | 1.0 / 0.40 | 30 y 87.4% |
| Waaree Elite BiN-08 560–600 | TOPCon | 144 M10/M10R | 560–600 | 23.23 | 21.68–23.23 | -0.30 | 80 ±10 | 1.0 / 0.40† | 30 y 87.4% |
| Sunpro Power SPDG585–600-N144M10 | N-type (unconf.) | 144 M10 | 585–600 | 23.22 | 22.64–23.22 | -0.30 | Not stated¹ | 1.0 / 0.40† | 30 y 87.4% |
| Heliene 144HC M10 NTYP SL Bifacial 570–600 | N-type (unconf.) | 144 M10 | 570–600 | 23.22 | 22.06–23.22 | -0.31 | 78 ±5 | 1.0 / 0.40 | 25 y 89.4% |
| Qcells Q.TRON XL-G2.3/BFG 620–645 | N-type (unconf.) | 156 M10-class | 620–645 | 23.10 | 22.2–23.10 | -0.29 | 80 ±5 | 1.5 / 0.33 | 30 y 88.9% |
| Sunpro Power SPDG435–450-N108M10 | N-type (unconf.) | 108 M10 | 435–450 | 23.04 | 22.28–23.04 | -0.30 | 80 (prior sheet) | 1.0 / 0.40† | 30 y 87.4% |
| ZN Shine ZXM7-UHLDD108 420–450 (black) | TOPCon | 108 M10 | 420–450 | 23.04 | 21.51–23.04 | -0.30 | 80 ±10 | 1.0 / 0.40 | 30 y 87.4% |
| Mission Solar MSH10-585–595HN4G | TOPCon | 144 M10* | 585–595 | 23.00 | 22.6–23.00 | -0.29 | 76.1 (calc.)² | 1.0 / 0.40 | 30 y 87.4% |
| Silfab SIL-620/630/640 XL Bifacial | N-type (unconf.) | 156 M10-class | 620–640 | 22.92 | 22.20–22.92 | -0.29 | 80 ±10 | 2.0 / 0.30† | 30 y 89.3% |
| JA Solar JAM72D42 615–640/LB (DeepBlue 4.0 Pro) | N-type (unconf.) | 144 M10R-class | 615–640 | 22.90 | 22.0–22.90 | -0.29 | 80 ±10 | 1.0 / 0.40 | 30 y 87.4% |
| Mission Solar MSX10-435–445HN0B | TOPCon | 108 M10* | 435–445 | 22.80 | 22.3–22.80 | -0.29 | Monofacial | 1.0 / 0.45 | 30 y 86.0% |
| Silfab SIL-580 XM+ Bifacial | N-type (unconf.) | 144 M10-class | 580 | 22.40 | 22.4–22.40 | -0.29 | 80 ±10 | 2.0 / 0.30† | 30 y 89.3% |
Manufacturer datasheets (versions in Table 3.4). Sorted by top-bin efficiency.
3.2 PERC products
| Manufacturer · model | Technology | Cells · format | Power W | Top-bin eff. % | Bin range % | γ %/°C | Bifaciality % | Deg. yr-1 / annual % | Warranty term · end‡ |
|---|---|---|---|---|---|---|---|---|---|
| Sunpro Power SPDG540–565-144M10 | PERC | 144 M10 | 540–565 | 21.86 | 20.89–21.86 | -0.34 | Not stated | 2.0 / 0.55† | 30 y 82.0% |
| Illuminate USA IL5-72HBD 540–560M | PERC (inferred) | 144 M10 | 540–560 | 21.70 | 20.9–21.70 | -0.34 | 70 ±5 | 2.0 / 0.45 | 30 y 85.0% |
| Illuminate USA IL5-78HBD 575–605M | PERC (inferred) | 156 M10 | 575–605 | 21.60 | 20.5–21.60 | -0.34 | 70 ±5 | 2.0 / 0.45 | 30 y 85.0% |
| JA Solar JAM72D30 530–555/MB (DeepBlue 3.0) | PERC | 144 M10 | 530–555 | 21.50 | 20.5–21.50 | -0.35 | 70 ±10 | 2.0 / 0.45 | 30 y 85.0% |
| Mission Solar MSH10-545–555HT4T | PERC | 144 M10* | 545–555 | 21.50 | 21.1–21.50 | -0.326 | 74.3 (calc.)² | 2.0 / 0.45 | 30 y 85.0% |
| Waaree Bi-55 520–550 | PERC | 144 M10 | 520–550 | 21.36 | 20.20–21.36 | -0.34 | 70 ±10 | 2.0 / 0.55† | 30 y 82.0% |
| Boviet Solar Vega BVM7612M 530–555-H-HC-BF | PERC | 144 M10* | 530–555 | 21.32 | 20.36–21.32 | -0.35 | 70 ±5 | 2.0 / 0.45 | 30 y 85.0% |
| Heliene 144HC M10 SL Bifacial 520–550 | PERC | 144 M10 | 520–550 | 21.30 | 20.1–21.30 | -0.34 | 70 ±5 | 2.0 / 0.50 | 25 y 86.0% |
| Talesun BIPRO TD7G72M 525–550 | PERC | 144 M10 | 525–550 | 21.10 | 20.1–21.10 | -0.36 | 70 ±5 | 2.0 / 0.45† | 30 y 85.0% |
Manufacturer datasheets (versions in Table 3.4). Sorted by top-bin efficiency.
3.3 Reference technologies: back contact, heterojunction and CdTe
| Manufacturer · model | Technology | Cells · format | Power W | Top-bin eff. % | Bin range % | γ %/°C | Bifaciality % | Deg. yr-1 / annual % | Warranty term · end‡ |
|---|---|---|---|---|---|---|---|---|---|
| LONGi Hi-MO X10 Explorer LR7-72HVD 625–645M | BC | 144 M10R-class | 625–645 | 23.90 | 23.1–23.90 | -0.26 | 70 ±5 | 1.0 / 0.35 | 30 y 88.8% |
| REC Alpha Pure-RX 450–470 | HJT | 88 REC prop. | 450–470 | 22.60 | 21.6–22.60 | -0.24 | Monofacial | 2.0 / 0.25 | 25 y 92.0% |
| First Solar Series 7 TR1 FS-7505–7540A | CdTe | thin film — | 505–540 | 19.30 | 18.1–19.30 | -0.32 | Monofacial | 2.0 / 0.30 | 30 y 89.3% |
Manufacturer datasheets (versions in Table 3.4). The REC Alpha Pure-RX is a residential-format module and is included only as the HJT reference. Its 92% value at year 25 is printed on the sheet.
3.4 Datasheet provenance, construction and US assembly
The table below records the exact document version behind each row, the module construction and what the datasheet itself says about US assembly. Assembly status is shown only as stated on the sheet. Where a sheet is silent, we do not infer it from marketing material or reseller listings.
| Manufacturer · model | Datasheet version / date | Dimensions (mm) · kg | Construction | US assembly (as stated on sheet) |
|---|---|---|---|---|
| Boviet Solar Vega BVM7612M 530–555-H-HC-BF | V7, January 14th, 2026 | 2296×1134×35 · 29 | 3.2 mm + transparent backsheet | Yes — “Made in USA since Q1 2025” badge; Vietnam also listed |
| Canadian Solar TOPBiHiKu7 CS7N-695–730TB-AG (TX) | V1.91_ | 2384×1303×35 · 37.9 | 2.0/2.0 dual | Yes — “Assembled in the US” |
| First Solar Series 7 TR1 FS-7505–7540A | MPD-00640-07-US, APR 2026 | 2300×1216 · 38.46 | heat-strengthened glass/glass | Yes — designed, sourced and manufactured in USA |
| Heliene 144HC M10 NTYP SL Bifacial 570–600 | HSPE_ | 2279×1134×35 · 29.2 | 3.2 mm + backsheet (glass-backsheet) | Yes — made in Minnesota (Heliene info sheet) |
| Heliene 144HC M10 SL Bifacial 520–550 | HSPE_ | 2279×1134×35 · 29.2 | 3.2 mm + backsheet | Yes — made in Minnesota (Heliene info sheet) |
| Illuminate USA IL5-72HBD 540–560M | IL20251204 | 2278×1134×30 · 31.8 | 2.0/2.0 dual | Yes — assembled in Pataskala, Ohio |
| Illuminate USA IL5-78HBD 575–605M | IL20251205 | 2465×1134×30 · 35.3 | 2.0/2.0 dual | Yes — assembled in Pataskala, Ohio |
| JA Solar JAM72D30 530–555/MB (DeepBlue 3.0) | Global_ | 2278×1134×30 · 31.8 | 2.0/2.0 dual | No — China/Vietnam |
| JA Solar JAM72D42 615–640/LB (DeepBlue 4.0 Pro) | Global-EN-20240326A | 2465×1134×30 · 34.6 | 2.0/2.0 dual | Not stated on sheet |
| Jinko Solar Tiger Neo 78HL4-BDV 625–650 | JKM625-650N-78HL4-BDV-F10-EN (2025) | 2465×1134×30 · 34.0 | 2.0/2.0 dual | Not stated on sheet |
| Jinko Solar Tiger Neo 3.0 66QL6-BDV 650–670 | JKM650-670N-66QL6-BDV-F4-EN (© 2026; PDF mod 2026-09-15) | 2382×1134×30 · 32.5 | 2.0/2.0 dual | Not stated on sheet |
| LONGi Hi-MO X10 Explorer LR7-72HVD 625–645M | 20240929V01 (distributor-hosted copy) | 2382×1134×30 · 33.5 | 2.0/2.0 dual | Not stated on sheet |
| Mission Solar MSH10-585–595HN4G | C-MKTG-0052 v2, 3/ | 2278×1134×35 · 32.5 | 2.0/2.0 dual | Not stated for this model |
| Mission Solar MSX10-435–445HN0B | C-MKTG-0050 v4, 12/ | 1722×1134×35 · 21.3 | 3.2 mm single + backsheet | Yes — “American-made”; domestic content 6.2% printed |
| Mission Solar MSH10-545–555HT4T | C-MKTG-0051 v1, 12/ | 2279×1134×35 · 27.5 | 3.2 mm + transparent backsheet | Not stated on sheet |
| Qcells Q.TRON XL-G2.3/BFG 620–645 | Q.TRON_ | 2462×1134×35 · 35.4 | 2.0/2.0 dual | Not stated on sheet |
| REC Alpha Pure-RX 450–470 | UL EN 6.2026 V7 | 1728×1205×30 · 22.7 | 3.2 mm + backsheet | No — Singapore |
| Silfab SIL-620/630/640 XL Bifacial | SIL-620-630-640-XL-BIFACIAL 20260521 | 2465×1133×35 · 29.5 | 3.2 mm + transparent backsheet | Yes — “Manufactured exclusively in the USA” |
| Silfab SIL-580 XM+ Bifacial | SIL-580-XM+-BIFACIAL 20260521 | 2278×1133×35 · 28.5 | 3.2 mm + transparent backsheet | Yes — “Manufactured exclusively in the USA” |
| Sunpro Power SPDG585–600-N144M10 | Official PDF, 2026/ | 2278×1134×30 · 31 | 2.0/2.0 dual | Not stated (US entity, Norcross GA, named) |
| Sunpro Power SPDG620–635-N132R12 | Official PDF, 2026/ | 2382×1134×30 · 32.4 | 2.0/2.0 dual | Not stated (US entity, Champaign IL, named) |
| Sunpro Power SPDG435–450-N108M10 | usa-datasheet ... v26.01.08 (PDF 2026-01-08) | 1722×1134×30 · 23.3 | 2.0/2.0 dual (full black) | Not stated on current sheet |
| Sunpro Power SPDG540–565-144M10 | Official PDF, 2026/ | 2278×1134×35 · 31 | 2.0 front / 2.0 white-mesh back | Not stated on sheet |
| Talesun BIPRO TM7G72M 585–605 | BIPRO_ | 2278×1134×30 · 31.8 | 2.0/2.0 dual | Not stated on sheet |
| Talesun BIPRO TD7G72M 525–550 | 02-BIPRO_ | 2300×1135×35 · 32 | 2.0/2.0 dual | Not stated on sheet |
| Trina Solar Vertex N TSM-NE19R 615–650 | TSM_ | 2382×1134×30 · 27.9 | 3.2 mm + backsheet | Not stated on sheet |
| Waaree Bi-55 520–550 | WEL/ | 2272×1133×35 · 32.5 | 2.0/2.0 dual | Not stated on sheet |
| Waaree Elite BiN-08 560–600 | WEL/ | 2278×1134 (t n/p) · 32 | 2.0/2.0 dual | Not stated on sheet |
| ZN Shine ZXM7-UHLDD144 575–605 | Version ZXM7-UHLDD144 2411.E (2024) | 2278×1134×30 · 31 | 2.0/2.0 dual | No — China (2405.E sheet) |
| ZN Shine ZXM7-UHLDD108 420–450 (black) | Version ZXM7-UHLDD108 2509.E (2025; PDF mod 2026-01-23) | 1722×1134×30 · 24.5 | 2.0/2.0 dual | Not stated on sheet |
Manufacturer datasheets. "t n/p" = thickness not printed. Construction is front/back glass in mm, or front glass plus backsheet.
Section 4Module Efficiency
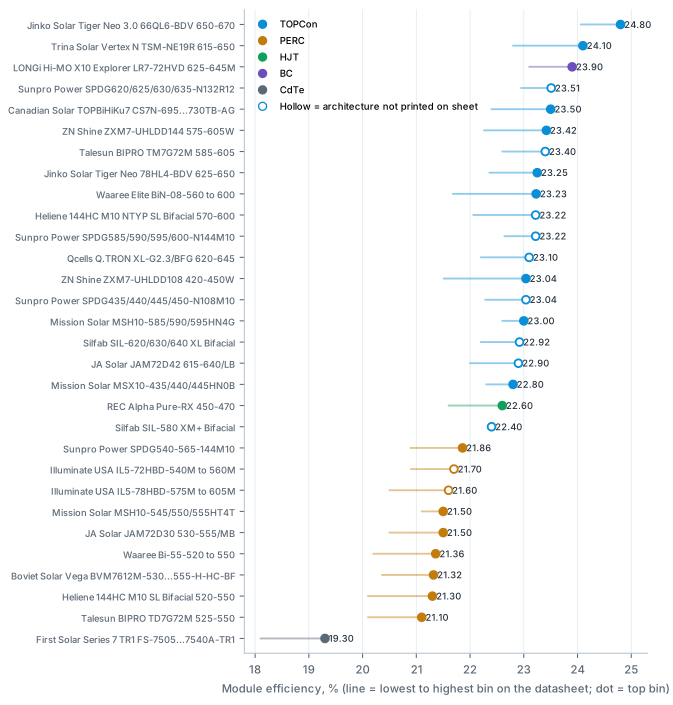
On datasheets, efficiency now sorts the market more clearly by technology than by manufacturer. Every n-type silicon product in the set sits above every PERC product. Within each technology, the spread is narrow.
4.1 The technology gap
The TOPCon-class group ranges from 22.40% to 24.80%. The PERC group ranges from 21.10% to 21.86%, so the two ranges do not overlap. The single back-contact product reaches 23.90%, the HJT reference 22.60% (a residential, monofacial 88-cell format) and CdTe 19.30%. In power-density terms, the median TOPCon product delivers about 232 W per square metre of module area under STC, against 215 W/m² for the median PERC product.
Datasheet and industry averages line up closely. ITRPV's 2025 mass-production averages are 21.7% for PERC and 23.5% for TOPCon. Our medians sit 0.2–0.3 points below those averages. That is expected, because our set includes several US-assembled and older-version products, as well as the efficiency of the top bin rather than the production average. Fraunhofer ISE reports a shipment-weighted average c-Si module efficiency of 22.7% in Q4 2024 across the top-10 manufacturers, with a range of 18.9–24.8%. That range brackets the top bins in this benchmark.
4.2 What drives the spread within a technology
Within the TOPCon-class group, the highest values come from the newest cell and module formats. The four products at or above 23.5% use rectangular G12R/210R or G12-class cells, and the top value (24.80%) comes from a quarter-cut-cell design on a sheet dated 2026. The lower end of the group includes glass-backsheet constructions with 3.2 mm front glass and one monofacial 108-cell product. Interconnection, cell cutting, inactive area and glass/frame choices all move efficiency by tenths of a point, independently of the cell technology.
Format also explains apparent outliers in wattage. The Canadian Solar TOPBiHiKu7 reaches 730 W because its module area is about 3.1 m², against about 2.6 m² for a standard M10 144-cell module. Its efficiency (23.5%) is in the upper part of the TOPCon range, not beyond it. Conversely, 108-cell products from Sunpro Power, ZN Shine and Mission Solar print 435–450 W yet sit at 22.8–23.04% efficiency, in the middle of the TOPCon-class distribution.
4.3 Bin selection matters as much as brand
Datasheet bin ranges are wide. The ZN Shine UHLDD108 spans 21.51–23.04%, the Waaree BiN-08 21.68–23.23% and the ZN Shine UHLDD144 22.26–23.42%. A buyer specifying a mid-range bin on a high-efficiency sheet can receive a lower efficiency than the top bin of a competing sheet. Contracts should therefore name the exact bin or the minimum power, the positive-only tolerance and the flash-test data to be delivered, not only the product family.
4.4 What area efficiency buys
Higher efficiency reduces the module area, and with it the racking, land, wiring and labour, needed for a given DC capacity. As a simple illustration, using area = capacity ÷ (efficiency × 1,000 W/m²), 1 MWdc requires about 4,307 m² of module area at the TOPCon median (23.22%) and about 4,651 m² at the PERC median (21.50%). That is roughly 344 m², or 7.4%, less module area for TOPCon. Whether that reduction is worth a price premium depends on area-related balance-of-system costs, which are site-specific and outside the scope of this guide.
Section 5Temperature Coefficient and Hot-Climate Performance
Efficiency is rated at 25 °C, but modules in the US Southwest, Texas and the Southeast spend most of their productive hours far hotter. The temperature coefficient of maximum power, γPmax, tells you how much of the rated advantage survives in the field.
5.1 What the datasheets show
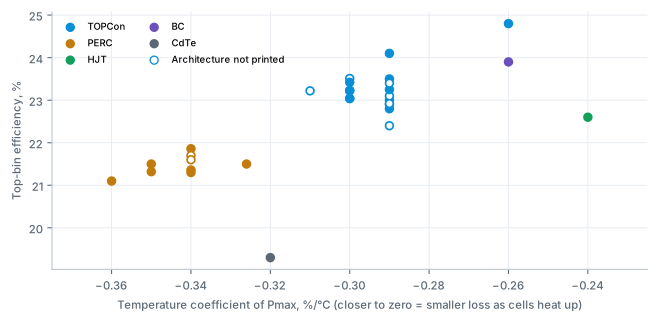
Datasheet γPmax values fall into clear technology bands:
- TOPCon-class: median −0.29%/°C (range −0.31 to −0.26). Ten of 18 sheets print −0.29 and six print −0.30.
- PERC: median −0.34%/°C (range −0.36 to −0.326).
- HJT reference: −0.24%/°C, the lowest value in the set.
- Back contact: −0.26%/°C.
- CdTe: −0.32%/°C.
Two products print −0.26%/°C: the G12R quarter-cut Jinko Tiger Neo 3.0 (the only TOPCon-class sheet below −0.29) and the LONGi HPBC back-contact product.
5.2 Independent confirmation
Kiwa PVEL's PAN-file testing measures temperature coefficients on production modules from each bill of materials (BOM) entered in its Product Qualification Program. Its 2026 medians, covering BOMs produced in 2023–2025, agree with the datasheets in direction and broadly in magnitude:
- TOPCon: −0.29%/°C, improved from −0.30;
- HJT: −0.26%/°C;
- back contact (xBC): −0.27%/°C;
- PERC: −0.32%/°C.
PERC datasheets in our set are somewhat more conservative than the PVEL median (−0.34 vs. −0.32). The single HJT datasheet is more favourable than the HJT median (−0.24 vs. −0.26).
5.3 Why it matters in hot climates
Power loss from heat scales approximately linearly with the cell's temperature above 25 °C: loss ≈ |γ| × ΔT. On a hot, sunny afternoon, cell temperatures 25–35 K above STC are common on fixed-tilt and tracker systems. At ΔT = 30 K, a PERC module at −0.34%/°C loses about 10.2% of its rated power, against 8.7% for TOPCon at −0.29%/°C and 7.2% for an HJT module at −0.24%/°C. Because those hours coincide with high irradiance, and in many US markets with high-value afternoon pricing, the gap carries more weight in energy and revenue than its size suggests.
Research on hot-climate yield supports the same direction. Haschke et al. (Energy & Environmental Science, 2017) showed that high open-circuit voltage and low series resistance drive performance in hot, sunny conditions, which favours heterojunction designs. They also showed that module-level temperature coefficients are less favourable than cell-level ones because of interconnection resistance. Kiwa PVEL reports that its PAN energy-yield threshold for Top Performer status rose by 0.34% for its Las Vegas desert simulation and 0.53% for Boston year on year. It attributes the rise to higher bifaciality and better temperature coefficients in the tested population.
5.4 NOCT and NMOT: handle with care
Datasheets also print a nominal operating temperature, either NOCT or NMOT, under different reference conditions. Values in the set range from 41 ± 3 °C to 45 ± 2 °C, and four sheets do not print one in the version we read. Because the two definitions differ and the value depends strongly on mounting, NOCT/NMOT should not be used to rank modules. Thermal modelling should rely on the PAN file and site-specific mounting parameters.
Section 6Bifaciality: Datasheet versus Measured
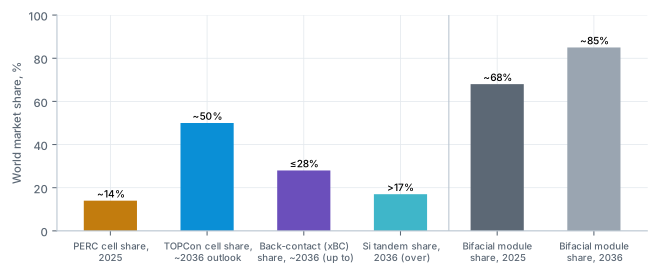
Bifacial modules generate additional energy from light reaching the rear surface. ITRPV reports that about 68% of modules are now bifacial and expects about 85% by 2036. The bifaciality factor φ, the ratio of rear-side to front-side efficiency, determines how much of that rear light becomes energy.
6.1 Datasheet values cluster at round numbers
Of the 14 TOPCon-class products with a printed or computed bifaciality, 11 print exactly 80%, usually with a tolerance of ±5% or ±10%. The exceptions are 85% on the Jinko Tiger Neo 3.0, 78% on the Heliene NTYP and a computed 76.1% for the Mission MSH10-HN4G. Every PERC sheet with a printed value states 70%, and the back-contact sheet also states 70%. The clustering reflects how manufacturers set nominal values, not a measured equality between products.
Four sheets require care:
- The 2026 Sunpro N144M10 and N132R12 sheets describe the products as bifacial and print a table at 15% rear-side power gain, but do not print a coefficient.
- The Sunpro N108M10 value of 80% comes from the prior version of the same family's sheet.
- The two Mission Solar MSH10 sheets print a rear-side power table rather than φ. Our computed values of 76.1% (TOPCon) and 74.3% (PERC) are ratios at the lowest bin and are labelled as computed.
6.2 What the independent data show
Kiwa PVEL's 2026 PAN medians give a clearer picture of real-world bifaciality:
- HJT: 86.2%;
- TOPCon: 76.5%;
- back contact (xBC): 70.8%;
- PERC: 70.2%.
The TOPCon median of 76.5% is within the typical ±5–10% datasheet tolerance but 3.5 points below the 80% nominal most sheets print. ITRPV reports back-contact bifaciality at 68% in 2025, the lowest of the silicon technologies, and expects it to rise to 80% by 2036. It expects TOPCon to reach up to 85%, PERC no more than 73%, and HJT above 90%.
6.3 From bifaciality to energy
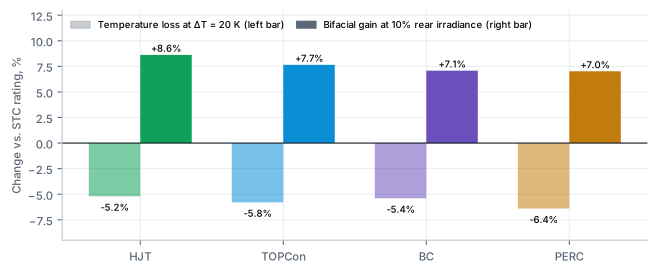
The extra energy from the rear side depends on φ and on the rear irradiance, which is driven by ground albedo, row height, tracker geometry and shading. A useful first approximation is bifacial gain ≈ φ × (rear ÷ front irradiance). Several datasheets in the set (JA Solar, Trina, Canadian Solar) print their bifacial electrical tables at a 10% rear-irradiance ratio. At that ratio, the PVEL medians translate into gains of about 8.6% for HJT, 7.7% for TOPCon, 7.1% for back contact and 7.0% for PERC. The gap between TOPCon and PERC is therefore about 0.6 points of energy. It is real but smaller than the headline 80% vs. 70% datasheet comparison would suggest.
Field data from NREL's bifacial test site in Golden, Colorado (single-axis trackers, albedo 0.19–0.21) measured an energy gain of about 6% for a bifacial PERC system and about 9% for an SHJ bifacial string. Modelled typical ranges were 4–8% for PERC and 6.5–11% for SHJ. A separate first-year NREL tracker study found bifacial modules produced about 9% more energy than monofacial, with the highest gains over snow. A SERIS study published in Joule (2020) found that bifacial modules on single-axis trackers give the lowest levelised cost of electricity across 93.1% of the global land area analysed.
Modelling note
Use the bifaciality measured for the specific bill of materials (from the PAN file or test report) in energy models, not the datasheet nominal. A 3–4 point difference in φ moves the modelled bifacial gain by roughly 0.3–0.4 percentage points at a 10% rear-irradiance ratio, and by more at high-albedo sites.
Section 7Degradation and Warranties
Over a 30-year life, differences in warranted degradation move guaranteed energy per installed kilowatt by several percentage points. Yet degradation is the term buyers negotiate least.
7.1 First-year and annual degradation
Warranted degradation separates the technologies cleanly. Every PERC sheet in the set warrants a 2.0% first-year loss. Every TOPCon-class sheet warrants 1.0%, except Qcells (1.5%) and Silfab (no more than 2%, i.e. at least 98% in year 1). Annual rates after year 1 are:
- TOPCon-class: 0.30–0.45%, median 0.40%;
- PERC: 0.45–0.55%;
- back contact (LONGi): 0.35%;
- CdTe (First Solar): 0.30%;
- HJT reference (REC): 0.25%, over a 25-year term.
ITRPV reports that the industry's average first-year degradation is falling from 1.5% (2025) to 1% in 2026, and expects annual degradation to fall slightly, to below 0.4%, within ten years.
7.2 Warranted output curves
The warranted minimum power at year t is 100% − d1 − d × (t − 1), where d1 is the first-year loss and d the annual rate. Applying the printed terms gives year-30 floors of:
- 87.4% for typical TOPCon (1.0% / 0.40%);
- 88.85% for the LONGi back-contact sheet;
- 88.93% for Qcells (1.5% / 0.33%);
- 89.3% for First Solar and Silfab (2.0% / 0.30%);
- 84.95% for typical PERC (2.0% / 0.45%);
- 82.05–82.1% for the PERC sheets warranting 0.55% per year.
The REC HJT sheet warrants 92% at year 25, the highest 25-year floor in the set.
7.3 Lifetime-average warranted output
The average of the warranty floor over years 1–30 summarises the whole curve in one number. On the typical terms it is 93.20% for TOPCon and 91.47% for PERC. That is a difference of 1.73 percentage points of guaranteed lifetime energy before any difference in efficiency, temperature or bifaciality. Products warranting 0.30–0.35% per year (Silfab, First Solar, Qcells, LONGi, Jinko Tiger Neo 3.0) average 93.65–93.92%. PERC sheets warranting 0.55% per year average 90.03%. The REC HJT terms extended to 30 years for comparison average 94.38%.
| Warranty terms (yr-1 / annual) | Products in this benchmark | Year-30 floor | Average yrs 1–30 |
|---|---|---|---|
| 2.0% / 0.25% (25-yr term) | REC Alpha Pure-RX (HJT) | 92.0% at yr 25 | 94.38%* |
| 1.0% / 0.35% | Jinko Tiger Neo 3.0; LONGi Hi-MO X10 | 88.85% | 93.92% |
| 1.5% / 0.33% | Qcells Q.TRON | 88.93% | 93.72% |
| 2.0% / 0.30% | Silfab XL, XM+; First Solar Series 7 | 89.30% | 93.65% |
| 1.0% / 0.40% | 13 TOPCon-class products | 87.40% | 93.20% |
| 1.0% / 0.45% | Mission MSX10 (monofacial TOPCon) | 86.0% | 92.47% |
| 2.0% / 0.45% | Six PERC products | 84.95% | 91.47% |
| 2.0% / 0.50% | Heliene PERC (25-yr term) | 86.0% at yr 25 | 90.75%* |
| 2.0% / 0.55% | Sunpro SPDG540–565; Waaree Bi-55 | 82.05–82.1% | 90.03% |
Manufacturer datasheets; averages computed by SolarStock USA Research as the mean of 100 − d1 − d(t − 1) for t = 1…30. *Terms extended beyond the 25-year warranty for comparison only. Trina NE19R and Heliene NTYP warrant 1.0% / 0.40% over 25 years and are counted in the 1.0% / 0.40% row.
7.4 Product warranty and the warrantor
Product (materials and workmanship) warranties in the set range from 12 years, the most common term, to 15 years (Sunpro Power, LONGi, Mission Solar MSH10 N-type, Heliene) and 25 years (Mission Solar MSX10 workmanship, Silfab with registration). REC offers 20 years, or 25 years under its ProTrust programme. One sheet (Waaree BiN-08) does not print the product-warranty term. ITRPV reports today's typical product warranty at 15 years and performance warranty at 27.5 years, and expects them to reach 20 and 35 years respectively over the next decade.
A warranty is only as strong as the entity standing behind it. Meyer Burger's 2025 insolvency filing is a reminder that warranty claims depend on the warrantor's continuity and on the legal entity named in the warranty document. Buyers should check which entity issues the warranty, whether it is backed by insurance or a US subsidiary, and how claims are tested and settled (Section 11).
Section 8Independent Reliability Evidence
Datasheets describe what a module should do. Independent accelerated testing shows what production samples actually did under stress. The 2025–2026 evidence points one way: efficiency is still rising, and failure rates in accelerated testing are rising faster.
8.1 Kiwa PVEL PV Module Reliability Scorecard 2026
Kiwa PVEL published its 12th Scorecard on 27 May 2026. It named 43 manufacturers as Top Performers, 13 of them for the first time. For the first time, no single bill of materials was a Top Performer in every test. Failure rates reached record levels. Eighty-seven percent of manufacturers and 61% of BOMs had at least one failure, up from 83% and 59% in the 2025 edition. Forty-five percent of manufacturers had at least one major delamination defect, and 26% of BOMs showed breakage in mechanical stress testing.
Kiwa PVEL's companion analysis breaks the failures down:
- Major visual defects made up 73% of failures, and half of those were breakage.
- Damp heat failed 32% of BOMs, with delamination the leading mode, although 69% of BOMs lost less than 2% of power in that test.
- Mechanical stress sequence (MSS) testing failed 30% of BOMs.
- Hail stress sequence (HSS) testing failed 23% of BOMs. At 45 mm hail, modules with 2.0 mm / 2.0 mm glass broke in 61% of cases, against 7% for thicker-glass constructions.
The hail result is directly relevant to procurement: thin dual-glass constructions now dominate high-efficiency TOPCon datasheets in this benchmark.
8.2 Kiwa PVEL Top Performers: the published list
Kiwa PVEL's 2026 Top Performer list includes, among manufacturers represented in this benchmark, ZN Shine, JA Solar, Waaree, Qcells, Canadian Solar, Jinko Solar, LONGi, Trina Solar and Illuminate USA. Participation in Kiwa PVEL's Product Qualification Program is voluntary and commissioned by manufacturers or buyers. A manufacturer's presence on the list applies to specific tested BOMs, and its absence carries no inference about product quality. Buyers should request the PQP report for the exact BOM being offered, not rely on a manufacturer-level listing.
The 2025 Scorecard (11th edition) named 50 manufacturers as Top Performers and evaluated more than 300 model types. Twenty-one model types were Top Performers in every reliability test. Seven percent of BOMs had safety failures, and about one-third of manufacturers had junction-box failures. In potential-induced degradation (PID) testing, 72% of BOMs produced in 2024 lost less than 2%.
8.3 RETC PV Module Index 2026
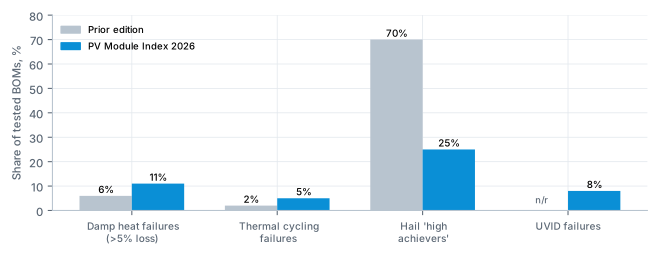
RETC's 2026 PV Module Index, published in June 2026, reports a similar deterioration:
- Damp-heat failures (more than 5% power loss) rose to 11% from 6%.
- Thermal-cycling failures rose to 5% from 2%.
- The share of hail "high achievers" fell to 25% from 70%.
- Eight percent of BOMs failed UVID testing.
RETC named 13 Overall Highest Achievers: Imperial Star, JA Solar, JinkoSolar, LONGi, Qcells, Runergy, SolarSpace, Thornova, Trina, VSUN, TW Solar, Waaree and Yingli. The published coverage does not break results down by cell technology.
8.4 UV-induced degradation in TOPCon
UVID became a separate Top Performer category in Kiwa PVEL's 2026 Scorecard, tested at a dose of 120 kWh/m² (UVID120). The results show both progress and wide variation:
- The median TOPCon loss fell to 3.0% from 4.2%.
- The share of BOMs failing fell to 3% from 6%, and 71% of BOMs were UVID Top Performers.
- Variation within a supplier remains large. In a spotlight case, two BOMs with the same cell supplier lost 14.1% (M10) and 3.6% (G12R).
- One year of outdoor exposure in Davis, California produced a median loss of 2% and a maximum of 8%.
- Storage in the dark after UV exposure caused further changes of up to 1% per day, more pronounced for TOPCon. Measurement protocol therefore matters.
Fraunhofer ISE reached a consistent conclusion in April 2025. Commercial TOPCon modules show metastable behaviour under UV, and common UV tests can overstate the degradation that persists in practice, so modules must be stabilised before measurement. The institute also found that many current TOPCon modules are UV-sensitive. For buyers, the practical message is to ask for UVID results on the offered BOM, measured with a stated stabilisation procedure.
8.5 Moisture and contact corrosion
A UNSW study with Canadian Solar (reported October 2024) exposed TOPCon cells to damp heat (85 °C / 85% relative humidity) with salt contaminants. Sodium chloride on the front side caused a severe rise in series resistance through the silver-aluminium contact paste, with about 92% relative efficiency loss under extreme contamination. Sodium bicarbonate on the rear caused about 16% loss after 100 hours. Clean control cells were stable. These are cell-level accelerated tests under deliberate contamination, not module field data. They nonetheless explain why encapsulant, edge sealing and glass-glass construction choices matter for TOPCon in humid and coastal US locations, and they are consistent with the rise in damp-heat failures reported by RETC and Kiwa PVEL.
What the reliability evidence means for an efficiency benchmark
None of the independent programmes publishes failure rates by technology in the sources reviewed, and none of the failure statistics can be attributed to a specific product in this guide. The evidence does establish that BOM-level variation within a single manufacturer can be larger than the variation between technologies. A datasheet efficiency figure says nothing about that variation, so BOM-specific test reports are the necessary complement.
Section 9Market Structure and Technology Roadmap
Global manufacturing has moved decisively to n-type silicon. The roadmap points to further efficiency gains from TOPCon refinement, back-contact designs and, after 2028, silicon-based tandem cells.
9.1 Production and technology shares
According to the ITRPV 17th edition (VDMA, June 2026):
- Module shipments reached about 706 GW in 2025.
- Production capacity at the end of 2025 was about 1,260 GWp for cells and 1,460 GWp for modules.
- Crystalline silicon holds about 98% of production.
- TOPCon was the dominant cell technology in 2025. PERC held only around 14% of the market and is expected to disappear over the next ten years.
- Double-sided-contact TOPCon is expected to hold around 50% of the market in a decade, and back-contact concepts up to 28%.
- Silicon-based tandem cells are expected to enter the market after 2028 and to exceed 17% share in 2036.
Fraunhofer ISE's July 2026 report, drawing on ITRPV data, puts the n-type wafer share at 86% in 2025 and describes TOPCon as dominant.
9.2 Efficiency roadmap
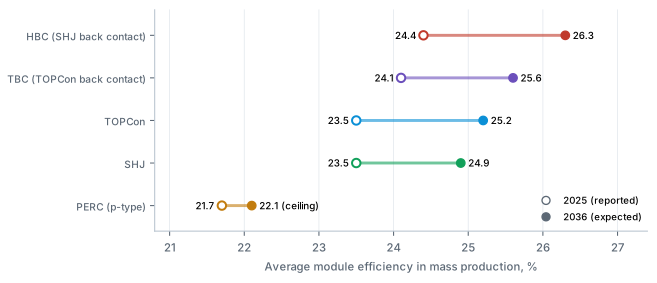
ITRPV's projections of average module efficiency in mass production give the trajectory against which current datasheets can be read:
- PERC: 21.7% in 2025, not expected to exceed 22.1%;
- TOPCon: 23.5% in 2025, up to 25.2% in ten years;
- SHJ: 23.5% in 2025, 24.9% in 2036;
- TBC: 24.1% in 2025, about 25.6% in 2036;
- HBC: 24.4% in 2025, about 26.3% in 2036;
- silicon-based tandem: about 27.4% expected in 2028 and up to 31% in 2036.
The top-bin values in this benchmark run a year or two ahead of these averages, as expected of the best bins of the newest products.
9.3 Laboratory and champion records
Fraunhofer ISE's July 2026 report, citing the Solar Cell Efficiency Tables (Version 68), lists record laboratory cell efficiencies of:
- 28.1% for monocrystalline silicon;
- 26.9% for perovskite;
- 35.2% for perovskite-on-silicon tandem;
- 21.0% for CdTe;
- 23.4% for CIGS.
The best laboratory module is monocrystalline silicon at 26.0%. Over the past decade, commercial monocrystalline modules have risen from about 17% to just under 25%, and CdTe modules from 15.6% to almost 20%.
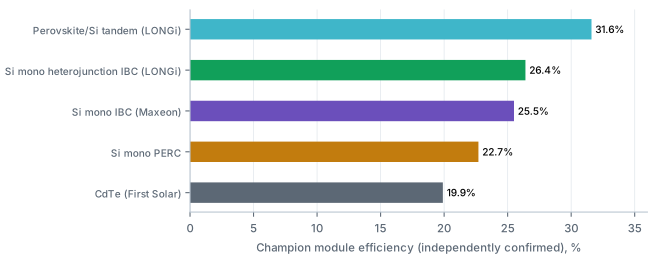
NLR's Champion Module Efficiencies chart (revision of 17 July 2026) records independently confirmed champion modules. They include 31.6% for a perovskite/silicon tandem module (LONGi), 26.4% for a silicon heterojunction back-contact module (LONGi), 25.5% for a silicon IBC module (Maxeon), 22.7% for silicon PERC and 19.9% for CdTe (First Solar).
9.4 Price context
Fraunhofer ISE reports a global average module selling price of about US$0.10/Wp in 2025. It notes that China's removal of its 9% export VAT refund in April 2026, together with rising material and shipping costs, is pushing global module prices up. ITRPV reports module prices roughly 9% higher at the end of 2025 and a historic learning rate of 26%. These are global figures. US module prices reflect trade measures, domestic-content considerations and logistics, and this guide does not report them.
Section 10Energy-Yield Implications
How large are the technology differences when expressed in kilowatt-hours? This section collects published field and simulation results, then sets out a transparent illustrative calculation for 1 MWdc in a hot US climate. The illustration is a teaching aid, not a yield forecast.
10.1 Published evidence
- Bifacial field gain (NREL). Measured gains in Golden, Colorado were about 6% (bifacial PERC) and about 9% (bifacial SHJ) on single-axis trackers, with modelled typical ranges of 4–8% and 6.5–11%.
- Bifacial tracking economics (SERIS, Joule 2020). Bifacial modules on single-axis trackers give the lowest LCOE across 93.1% of the global land area analysed. Bifacial-plus-tracking yields up to 35% more energy than conventional fixed systems.
- PAN-based simulation (Kiwa PVEL). The Top Performer energy-yield threshold rose 0.34% (Las Vegas) and 0.53% (Boston) year on year, driven by bifaciality and temperature-coefficient improvements across tested BOMs.
- Manufacturer-sponsored comparisons. These exist, for example a 2023 cold-climate comparison in Daqing, China published by SPIC, which reported TOPCon ahead of HJT, IBC and PERC. They are vendor-published, site-specific and should not be treated as independent benchmarks.
10.2 Illustrative calculation: 1 MWdc in a hot US climate
Illustrative — SolarStock USA Research calculation
The calculation below isolates three technology-level differences: temperature coefficient, bifaciality and warranted degradation. It applies them to a notional 1 MWdc array using stated assumptions. It ignores spectral response, low-light behaviour, incidence-angle effects, soiling, mismatch, clipping, availability and actual (rather than warranted) degradation. It is a ranking aid only. Use PVsyst or equivalent with BOM-specific PAN files for any project decision.
| Assumption | Value used | Basis |
|---|---|---|
| Array size | 1 MWdc (STC) | Normalisation |
| Reference specific yield before temperature and bifacial adjustment, Yref | 2,000 kWh/kWp per year | Round placeholder for arithmetic transparency; not a site estimate. Results scale linearly. |
| Effective cell-temperature excess, ΔT | 20 K, applied to all energy | Assumption for an irradiance-weighted hot-site average |
| Rear-to-front irradiance ratio, R | 10% | Matches the convention printed on several datasheets in the set |
| Temperature coefficient γ | HJT −0.26; BC −0.27; TOPCon −0.29; PERC −0.32 %/°C | Kiwa PVEL 2026 PAN medians |
| Bifaciality φ | HJT 86.2; TOPCon 76.5; BC 70.8; PERC 70.2 % | Kiwa PVEL 2026 PAN medians |
| Degradation (yr-1 / annual) | HJT 2.0/0.25; TOPCon 1.0/0.40; BC 1.0/0.35; PERC 2.0/0.45 % | Warranty floors on representative datasheets (Section 7) |
Formulas.
- Temperature loss = |γ| × ΔT.
- Bifacial gain = φ × R.
- Year-1 energy E1 = 1,000 kWp × Yref × (1 − temperature loss) × (1 + bifacial gain).
- Thirty-year energy = Σt=1…30 E1 × [1 − d1 − d(t − 1)]. Year-1 energy is shown before degradation; the 30-year total applies the warranty floor in every year, including year 1.
| Technology | Temp. loss | Bifacial gain | Year-1 MWh | Yr 1 vs. PERC | Avg. warranted output yrs 1–30 | 30-year MWh | 30 yr vs. PERC |
|---|---|---|---|---|---|---|---|
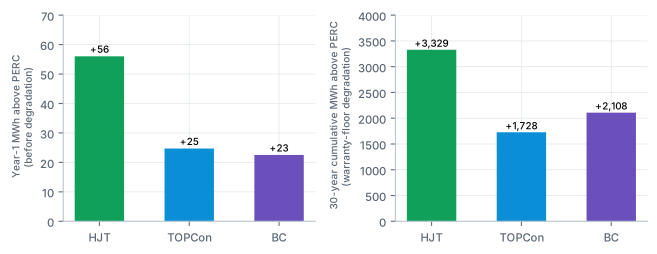
| HJT | 5.2% | 8.6% | 2,059 | +56 (+2.8%) | 94.38% | 58,308 | +3,329 (+6.1%) |
| TOPCon | 5.8% | 7.7% | 2,028 | +25 (+1.2%) | 93.20% | 56,706 | +1,728 (+3.1%) |
| Back contact | 5.4% | 7.1% | 2,026 | +23 (+1.1%) | 93.92% | 57,086 | +2,108 (+3.8%) |
| PERC | 6.4% | 7.0% | 2,003 | — | 91.47% | 54,979 | — |
Illustrative calculation by SolarStock USA Research under the assumptions above. Year-1 energy is before degradation. Differences are computed before rounding.
10.3 Reading the illustration
Under these assumptions, a TOPCon array produces about 1.2% more energy than a PERC array of the same DC rating in year 1. About 0.6 points come from the better temperature coefficient and about 0.6 points from higher bifaciality. Over 30 years, the gap grows to about 3.1%, because the warranted degradation path contributes more than the year-1 physics. HJT's advantage is roughly twice TOPCon's on both measures. The back-contact result sits between them over 30 years: its lower bifaciality is offset by better temperature behaviour and slower warranted degradation.
Three caveats matter more than the point estimates:
- The differences scale with Yref, ΔT and R. At a site with high albedo, the bifacial component roughly doubles if R doubles. At a cooler site, the temperature component shrinks.
- Warranty floors are not expected degradation. Field degradation of well-made modules is usually slower than the floor, and a weak BOM can be worse.
- BOM-level variation in UVID, damp-heat and mechanical performance (Section 8) can be larger than any of the technology differences shown here.
10.4 A second illustration: datasheet values instead of measured medians
Repeating the temperature step with datasheet medians rather than PVEL medians (TOPCon −0.29, PERC −0.34%/°C) widens the year-1 temperature gap to 1.0 point (5.8% vs. 6.8% loss at ΔT = 20 K). Using datasheet bifaciality (80% vs. 70%) widens the bifacial gap to 1.0 point at R = 10%. The datasheet-based comparison therefore overstates the TOPCon–PERC year-1 energy difference by roughly 0.8 percentage points relative to the measured-median comparison. That is a useful reminder to model with PAN data, not with brochure values.
Section 11Procurement Checklist
Efficiency belongs on the specification, but it is only one of several documents that determine whether a module will deliver its modelled energy. The checklist below sets out what to request and why. It applies equally to every manufacturer and technology in this guide.
A. Product identity and datasheet
- The current datasheet version, with version code and date, for the exact model and power bin offered. Confirm that the version attached to the purchase order matches the one evaluated.
- Written confirmation of the cell architecture (TOPCon, HJT, back contact or PERC) where the datasheet prints only "N-type" or "p-type".
- Bifaciality coefficient (φPmax) with tolerance, where the sheet prints only a rear-gain table or nothing.
- Power bin, positive-only power tolerance, and the flash-test (I-V) data format to be delivered with each pallet or container.
- Country of cell and module manufacture for the specific lots to be shipped, not only for the product family.
B. Performance files and independent test reports
- PAN file(s) generated by an independent laboratory for the offered BOM, with test date. Use these, not datasheet values, in PVsyst or equivalent energy models.
- Kiwa PVEL PQP report and/or RETC test results for the exact BOM. Check that the BOM documented (cell supplier, encapsulant, backsheet or rear glass, junction box) matches the one being supplied.
- UVID results with the stabilisation and measurement procedure stated, particularly for TOPCon.
- Damp-heat, thermal-cycling, PID, mechanical-stress and hail results, including the hail diameter tested. Be especially careful with 2.0/2.0 mm dual-glass constructions at hail-exposed sites.
- IEC 61215 / IEC 61730 and UL 61730 certificates covering the offered BOM and the factory of manufacture.
C. BOM control and quality assurance
- A BOM lock clause: no change to cells, encapsulant, glass, backsheet, frame or junction box without written notice and requalification evidence.
- Factory audit or in-line inspection rights, and pre-shipment electroluminescence (EL) imaging criteria.
- Incoming-inspection sampling plan with agreed acceptance limits for power, EL defects and visual defects.
D. Warranty terms
- Product warranty term and power warranty curve (year-1 loss, annual rate, end value), copied from the warranty document itself, not the datasheet.
- The legal entity issuing the warranty, its US presence, and any third-party warranty insurance.
- Claims procedure: who measures, which laboratory, at whose cost, and which measurement tolerance applies.
- Whether the warranty covers the specific mounting (for example, the tracker model) and installation conditions.
E. Supply-chain and policy documentation
- Documentation supporting any domestic-content, origin or traceability claims, at the level of detail the project's advisers require.
- Bankability information the financing parties require, which may include independent lists or engineering reviews.
Section 12US Manufacturing Note
Ten of the 30 datasheets in this benchmark state that the product is assembled or manufactured in the United States. They span PERC, TOPCon-class and CdTe products. On average they sit lower in the efficiency ranking, because six of the ten are PERC, CdTe or monofacial products, but they may carry policy-related value that a datasheet efficiency figure does not capture.
12.1 US-assembled models in the benchmark
The table lists only products whose datasheet itself states US assembly or manufacture. Other products in the set may also be available from US factories, but their sheets are silent and they are not listed here.
| Manufacturer · model | Technology | Top-bin eff. % | γ %/°C | Bifaciality % | Statement on datasheet |
|---|---|---|---|---|---|
| Canadian Solar TOPBiHiKu7 CS7N-695–730TB-AG (TX) | TOPCon | 23.50 | -0.29 | 80 | Yes — “Assembled in the US” |
| Heliene 144HC M10 NTYP SL Bifacial 570–600 | N-type (unconf.) | 23.22 | -0.31 | 78 ±5 | Yes — made in Minnesota (Heliene info sheet) |
| Silfab SIL-620/630/640 XL Bifacial | N-type (unconf.) | 22.92 | -0.29 | 80 ±10 | Yes — “Manufactured exclusively in the USA” |
| Mission Solar MSX10-435–445HN0B | TOPCon | 22.80 | -0.29 | Monofacial | Yes — “American-made”; domestic content 6.2% printed |
| Silfab SIL-580 XM+ Bifacial | N-type (unconf.) | 22.40 | -0.29 | 80 ±10 | Yes — “Manufactured exclusively in the USA” |
| Illuminate USA IL5-72HBD 540–560M | PERC (inferred) | 21.70 | -0.34 | 70 ±5 | Yes — assembled in Pataskala, Ohio |
| Illuminate USA IL5-78HBD 575–605M | PERC (inferred) | 21.60 | -0.34 | 70 ±5 | Yes — assembled in Pataskala, Ohio |
| Boviet Solar Vega BVM7612M 530–555-H-HC-BF | PERC | 21.32 | -0.35 | 70 ±5 | Yes — “Made in USA since Q1 2025” badge; Vietnam also listed |
| Heliene 144HC M10 SL Bifacial 520–550 | PERC | 21.30 | -0.34 | 70 ±5 | Yes — made in Minnesota (Heliene info sheet) |
| First Solar Series 7 TR1 FS-7505–7540A | CdTe | 19.30 | -0.32 | Monofacial | Yes — designed, sourced and manufactured in USA |
Manufacturer datasheets; Heliene brand information sheet (October 2025) for the Minnesota location. Statements summarised from each document.
The median top-bin efficiency of these ten products is 22.05%, against 23.22% for the TOPCon-class group as a whole. Within the US-assembled subset, the TOPCon-class products reach 22.4–23.5% and sit inside the overall TOPCon range. The Canadian Solar Texas-assembled TOPBiHiKu7 (23.5%), Heliene NTYP (23.22%) and Silfab XL (22.92%) are examples. The lower median reflects technology mix, not a US efficiency penalty within a technology.
12.2 Heterojunction and new capacity
At the end of May 2025, Meyer Burger's German subsidiaries filed for insolvency, and its Goodyear, Arizona HJT module plant (planned at 1.4 GW) ceased production. Warranty-servicing arrangements for US customers were not reported in the coverage reviewed. Meyer Burger is not included in the benchmark tables.
T1 Energy reported producing 2.79 GW of modules at its G1_Dallas facility in 2025, against 5 GW of nameplate capacity, and 935 MW in Q2 2026 alone. Its G2_Austin TOPCon cell factory has a first phase of 2.1 GW (5 GW planned) under construction. With its Q2 2026 results (August 2026), T1 said it is targeting first cell production there in Q1 2027. In July 2026, T1 announced the acquisition of a TOPCon patent portfolio for $135 million. No public T1 module datasheet was available for this benchmark.
Two other factory developments are relevant to brands in the tables:
- Qcells, Cartersville, Georgia. Hanwha announced in June 2026 that cell production had begun and that the module line was running at full capacity. The company is targeting 3.3 GW each of ingots, wafers and cells and 3.5 GW of modules a year by Q3 2026. Start of ingot and wafer output has not been confirmed, and the Q.TRON datasheet does not name a plant.
- Waaree Solar Americas, Brookshire, Texas. Waaree began commercial module production at its 1.6 GW Brookshire factory in January 2025. Its board approved a further 1.6 GW of module capacity in April 2025, for 3.2 GW in total; neither the expansion nor US cell production is confirmed as operating. The BiN-08 datasheet does not state the place of assembly.
12.3 Domestic content on datasheets
One datasheet in the set, the Mission Solar MSX10, prints a domestic-content percentage (6.2%). A printed figure of this kind describes the manufacturer's own calculation for the module. It is not, by itself, a determination of a project's eligibility for any federal domestic-content provision, which depends on the project's full set of components, applicable guidance and the taxpayer's documentation.
Section 13Methodology, Sources & Disclosures
13.1 Methodology
SolarStock USA Research compiled 30 module datasheets between September and October 2026, using the source hierarchy and version rules in Section 1. Every datasheet value was read from the document and recorded with its version. Technology medians and ranges are simple (unweighted) statistics across module families. They are not weighted by shipments or market share. Derived values (annual degradation from end-points, computed bifaciality from rear-side power tables, year-30 and lifetime-average warranted output) are computed only from values printed on the same sheet, with the formula stated. Illustrative calculations in Sections 4 and 10 are labelled as such and list every assumption.
Independent evidence was taken from the published Kiwa PVEL Scorecard materials (2025 and 2026), RETC PV Module Index 2026 coverage, ITRPV 17th edition, the Fraunhofer ISE Photovoltaics Report (July 2026), the NLR Champion Module Efficiencies chart, Fraunhofer ISE research communications, and peer-reviewed or laboratory publications cited below. Where an independent source was available only through trade-press coverage, the press article is cited.
13.2 Sources
Primary — manufacturer datasheets
- Boviet Solar Vega BVM7612M 530–555-H-HC-BF — V7, January 14th, 2026. https://cdn.shopify.com/s/files/1/0613/5188/6982/files/3-Vega-BVM7612M-530-555W-H-HC-BF_1.pdf
- Canadian Solar TOPBiHiKu7 CS7N-695–730TB-AG (TX) — V1.91_F43M_D3A_TX, January 2026. https://s3.us-east-2.amazonaws.com/media.sunhub.com/attachments/CS-Datasheet-TOPBiHiKu7_CS7N-TB-AG_v1.91_F43M_D3A_TX-%283%29-%281%29_c33a4fe6.pdf
- First Solar Series 7 TR1 FS-7505–7540A — MPD-00640-07-US, APR 2026. https://firstsolar.com/-/media/First-Solar/Technical-Documents/Series-7/Series-7-TR1-Datasheet.ashx
- Heliene 144HC M10 NTYP SL Bifacial 570–600 — HSPE_144HC_M10_NTYP_SL_Bifacial_Rev.03 (dated June 18, 2026). https://heliene.com/wp-content/uploads/HSPE_144HC_M10_NTYP_SL_Bifacial_Rev.03.pdf
- Heliene 144HC M10 SL Bifacial 520–550 — HSPE_144HC_M10_SL_Bifacial_Rev.06 (2026). https://heliene.com/wp-content/uploads/HSPE_144HC_M10_SL_Bifacial_Rev.06.pdf
- Illuminate USA IL5-72HBD 540–560M — IL20251204. https://www.illuminateusa.com/wp-content/uploads/Illuminate-USA_Product-Datasheet_IL5-72-HBD-540560-10BB.pdf
- Illuminate USA IL5-78HBD 575–605M — IL20251205. https://www.illuminateusa.com/wp-content/uploads/Illuminate-USA_Product-Datasheet_IL5-78-HBD-575605M-10BB.pdf
- JA Solar JAM72D30 530–555/MB (DeepBlue 3.0) — Global_EN_20230711A. https://solarproof.com.au/datasheets/panel_datasheet_20230712104738160.pdf
- JA Solar JAM72D42 615–640/LB (DeepBlue 4.0 Pro) — Global-EN-20240326A. https://www.solarproof.com.au/datasheets/panel_datasheet_ba0a870e2c22c89-compressed.pdf
- Jinko Solar Tiger Neo 78HL4-BDV 625–650 — JKM625-650N-78HL4-BDV-F10-EN (2025). https://www.jinkosolar.com/uploads/JKM625-650N-78HL4-BDV-F10-EN.pdf
- Jinko Solar Tiger Neo 3.0 66QL6-BDV 650–670 — JKM650-670N-66QL6-BDV-F4-EN (© 2026; PDF mod 2026-09-15). https://www.jinkosolar.com/uploads/JKM650-670N-66QL6-BDV-F4-EN.pdf
- LONGi Hi-MO X10 Explorer LR7-72HVD 625–645M — 20240929V01 (distributor-hosted copy). https://liriksolar.com/image/uploads/LONGI%20Solar%20Hi-MO%20X10%20Explorer%20LR7-72HVD-640M%20Bifacial%20Datasheet.pdf
- Mission Solar MSH10-585–595HN4G — C-MKTG-0052 v2, 3/4/2026. https://sdoplnddaeplfnrzkkoh.supabase.co/storage/v1/object/public/solar-files/datasheets/mission-solar-msh10-590hn4g.pdf
- Mission Solar MSX10-435–445HN0B — C-MKTG-0050 v4, 12/02/2025. https://sdoplnddaeplfnrzkkoh.supabase.co/storage/v1/object/public/solar-files/datasheets/mission-solar-msx10-435hn0b.pdf
- Mission Solar MSH10-545–555HT4T — C-MKTG-0051 v1, 12/8/2025. https://sdoplnddaeplfnrzkkoh.supabase.co/storage/v1/object/public/solar-files/datasheets/mission-solar-msh10-550ht4t.pdf
- Qcells Q.TRON XL-G2.3/BFG 620–645 — Q.TRON_XL-G2-BFG_series_620-645_DA_2026-02_Rev10_NA. https://www.solarelectricsupply.com/media/sparsh/product_attachment/Qcells_Data_sheet_Q.TRON_XL-G2-BFG_series_620-645_DA_2026-02_Rev10_NA.pdf
- REC Alpha Pure-RX 450–470 — UL EN 6.2026 V7. https://www.recgroup.com/sites/default/files/2025-01/Web_DS_REC%20Alpha%20Pure-RX_EN%20US.pdf
- Silfab SIL-620/630/640 XL Bifacial — SIL-620-630-640-XL-BIFACIAL 20260521. https://silfabsolar.com/wp-content/uploads/2026/05/Silfab-SIL-620-630-640-XL-Bifacial-Data-Final.pdf
- Silfab SIL-580 XM+ Bifacial — SIL-580-XM+-BIFACIAL 20260521. https://silfabsolar.com/wp-content/uploads/2026/05/Silfab-SIL-580-XM-Bifacial-Data-Final.pdf
- Sunpro Power SPDG585–600-N144M10 — Official PDF uploaded 2026/06, PDF ModDate 2026-07-16 (no printed version no.). https://www.sunpropower.us/wp-content/uploads/2026/06/N-type-SPDGxxx-N144M10-585-600W-30mm-Staubli.pdf
- Sunpro Power SPDG620–635-N132R12 — Official PDF uploaded 2026/06 (PDF ModDate 2026-07-16); sunhub copy labelled V26.04. https://www.sunpropower.us/wp-content/uploads/2026/06/N-type-SPDGxxx-N132R12-620-635W-30mm-Staubli.pdf
- Sunpro Power SPDG435–450-N108M10 — usa-datasheet ... v26.01.08 (PDF 2026-01-08). https://sdoplnddaeplfnrzkkoh.supabase.co/storage/v1/object/public/solar-files/datasheets/usa-datasheet-spdg-n108m10-ga-fullblack-staubli-936pcs-v26.01.08.pdf
- Sunpro Power SPDG540–565-144M10 — Official PDF uploaded 2026/06 (PDF ModDate 2026-07-16). https://www.sunpropower.us/wp-content/uploads/2026/06/P-type-SPDGxxx-144M10-540-565W-35mm-Compatible.pdf
- Talesun BIPRO TM7G72M 585–605 — BIPRO_TM7G72M_16BB-30mm-frame_20250515_EN. https://cdn.shopify.com/s/files/1/0903/2233/8102/files/BIPRO_TM7G72M-_16BB-30mm-frame_20250515_EN.pdf
- Talesun BIPRO TD7G72M 525–550 — 02-BIPRO_TD7G72M_10BB-35mm-frame_20240322_EN. https://store.solarcellzusa.com/Item%20Documents/02-BIPRO_TD7G72M_10BB-35mm-frame_20240322_EN_78163496.pdf
- Trina Solar Vertex N TSM-NE19R 615–650 — TSM_EN_2025_C (PDF 2025-12-26). https://www-cdn.trinasolar.com/wwwstorage/sites/3/dt-m-0093-g-en-e-datasheet-vertex-ne19r-2025-c-20251227090656440235.pdf
- Waaree Bi-55 520–550 — WEL/E&PD/520-550/144/MPB/HC/12/03.01.2025. https://sdoplnddaeplfnrzkkoh.supabase.co/storage/v1/object/public/solar-files/datasheets/datasheet-waaree-bi-55-545-550.pdf
- Waaree Elite BiN-08 560–600 — WEL/E&PD/560-600/144/BiN-08/HC/11/15.09.2025. https://ussolarsupplier.com/cdn/shop/files/575W_Waaree_Solar_Panel.pdf
- ZN Shine ZXM7-UHLDD144 575–605 — Version ZXM7-UHLDD144 2411.E (2024). https://sdoplnddaeplfnrzkkoh.supabase.co/storage/v1/object/public/solar-files/datasheets/znshine-zxm7-uhldd144-595w.pdf
- ZN Shine ZXM7-UHLDD108 420–450 (black) — Version ZXM7-UHLDD108 2509.E (2025; PDF mod 2026-01-23). https://sdoplnddaeplfnrzkkoh.supabase.co/storage/v1/object/public/solar-files/datasheets/znshine-zxm7-uhldd108-440w-bob.pdf
- Heliene, brand information sheet (October 2025). https://heliene.com/wp-content/uploads/Heliene-Info-Sheet-Brand-10.2025-6.pdf
- Sunpro Power, SPDGxxx-N108M10 410–440 W datasheet (prior version, bifaciality reference). https://sdoplnddaeplfnrzkkoh.supabase.co/storage/v1/object/public/solar-files/datasheets/datasheet-spdg440-n108m10-topcon.pdf
Independent testing and research
- Kiwa PVEL, PV Module Reliability Scorecard 2026 — manufacturer list and PAN performance. https://scorecard.pvel.com/manufacturer ; https://scorecard.pvel.com/pan-performance
- Kiwa PVEL, 2026 Scorecard UVID results. https://2026scorecardsbx.pvel.com/uvid
- Kiwa PVEL, "Exploring the rise of PV module failures and their potential causes" (2026). https://www.kiwa.com/globalassets/us/pvel/resources/2026-kiwa-pvel----exploring-the-rise-of-pv-module-failures-and-their-potential-causes.pdf
- Kiwa, "Inside Kiwa PVEL's 2025 PV Module Reliability Scorecard". https://www.kiwa.com/en/insights/stories/inside-kiwa-pvels-2025-pv-module-reliability-scorecard/
- Fraunhofer ISE, press release on UV tests for TOPCon modules (10 April 2025). https://www.ise.fraunhofer.de/en/press-media/press-releases/2025/fraunhofer-ise-evaluates-common-uv-tests-for-topcon-modules-for-practical-relevance.html
- NLR (formerly NREL), Champion Module Efficiencies chart, Rev. 07-17-2026. https://www.nlr.gov/docs/libraries/pv/champion-module-chart.pdf
- NREL, bifacial PV field performance poster, NREL/PO-5K00-74830 (September 2019). https://nrel.gov/docs/fy20osti/74830.pdf
- Haschke, J. et al., "The impact of silicon solar cell architecture and cell interconnection on energy yield in hot & sunny climates", Energy & Environmental Science (2017).
Market data
- VDMA, International Technology Roadmap for Photovoltaics (ITRPV), 2025 Results, 17th Edition (June 2026). https://www.vdma.eu/en/international-technology-roadmap-photovoltaic
- Fraunhofer ISE, Photovoltaics Report (Freiburg, 14 July 2026). https://www.ise.fraunhofer.de/content/dam/ise/de/documents/publications/studies/Photovoltaics-Report.pdf (landing page: https://www.ise.fraunhofer.de/en/publications/studies/photovoltaics-report.html)
Industry and press
- pv magazine USA, Kiwa PVEL 2026 Scorecard coverage (27 May 2026). https://pv-magazine-usa.com/2026/05/27/kiwa-pvels-2026-solar-module-reliability-scorecard-reveals-high-failure-rates-amid-incremental-increases-in-performance/
- Solar Power World, "Latest PV module reliability scorecard shows unsettling uptick in failures" (May 2026). https://www.solarpowerworldonline.com/2026/05/latest-pv-module-reliability-scorecard-shows-unsettling-uptick-in-failures/
- pv magazine USA, RETC PV Module Index 2026 coverage (3 June 2026). https://pv-magazine-usa.com/2026/06/03/latest-retc-solar-module-quality-report-reveals-significant-issues/
- pv magazine USA, UNSW TOPCon contact-corrosion research (7 October 2024). https://pv-magazine-usa.com/2024/10/07/new-research-shows-vulnerability-of-topcon-solar-cells-to-contact-corrosion/
- pv magazine USA, Meyer Burger insolvency (2 June 2025). https://pv-magazine-usa.com/2025/06/02/meyer-burger-files-for-insolvency-lays-off-over-900-workers/
- TaiyangNews, T1 Energy FY2025 production (3 April 2026). https://taiyangnews.info/business/t1-energy-produces-279-gw-modules-in-fy-2025
- PV Tech, "T1 Energy reports US$250 million Q2 sales" (14 August 2026). https://www.pv-tech.org/t1-energy-reports-us250-million-q2-sales/
- T1 Energy, G2_Austin factory page. https://t1energy.com/factory/g2-austin/
- Hanwha / Qcells, press release on cell manufacturing in Cartersville, Georgia (11 June 2026). https://www.hanwha.com/newsroom/news/press-releases/qcells-begins-solar-cell-manufacturing-at-americas-first-and-only-vertically-integrated-solar-factory-in-cartersville-georgia.do
- Solar Power World, "Qcells starts production of solar cells in United States" (9 June 2026). https://www.solarpowerworldonline.com/2026/06/qcells-starts-production-of-solar-cells-in-united-states/
- pv magazine, "Waaree's 1.6 GW solar factory in Texas starts commercial production" (24 January 2025). https://www.pv-magazine.com/2025/01/24/waarees-1-6-gw-solar-factory-in-texas-starts-commercial-production/
- Mercom, "Waaree to Double Texas Solar Module Manufacturing Plant Capacity to 3.2 GW" (15 April 2025). https://www.mercomindia.com/waaree-to-double-texas-solar-module-manufacturing-plant-capacity-to-3-2-gw
- pv magazine USA, T1 Energy TOPCon patent portfolio acquisition (28 July 2026). https://pv-magazine-usa.com/2026/07/28/t1-energy-acquires-topcon-solar-patent-portfolio-from-evervolt-in-135-million-deal/
- pv magazine USA, SERIS bifacial tracking LCOE study (8 June 2020). https://pv-magazine-usa.com/2020/06/08/single-axis-bifacial-pv-offers-lowest-lcoe-in-vast-majority-of-worlds-land-area/
- TaiyangNews, NREL bifacial tracker study (March 2020). https://taiyangnews.info/technology/bifacial-pv-panels-manifest-significant-boost-in-nrel-study
- pv magazine, SPIC energy-yield comparison press release (2023; manufacturer-sponsored). https://www.pv-magazine.com/press-releases/energy-yield-comparison-by-spic-topcon-vs-hjt-vs-ibc/
13.3 Limitations and assumptions
- Datasheet values are manufacturer statements at STC, not measurements of delivered modules. Measurement and power tolerances (typically ±3% or 0 to +5 W) are of the same order as many inter-product differences.
- Nine TOPCon-class rows rely on the "N-type (unconfirmed TOPCon)" classification. Two Illuminate USA rows are classified PERC by inference from printed p-type gallium-doped cells and their thermal and bifacial values.
- HJT, back-contact and CdTe groups each contain one product. Technology-level statements for these groups rely on Kiwa PVEL and ITRPV data, not on the benchmark medians.
- Kiwa PVEL and RETC do not publish failure rates by technology in the materials reviewed. Their lists are manufacturer- or BOM-specific and participation is voluntary.
- The ITRPV per-year technology shares in Fig. 29 have not been digitised, so only values stated in the ITRPV text are used. NLR champion values are taken from the chart's printed labels.
- Illustrative calculations use simplified physics and warranty-floor degradation and are not energy forecasts.
- Datasheets change. Values are correct for the versions listed in Table 3.4 and may differ from later versions.
13.4 About SolarStock USA Research
SolarStock USA Research is the analytical desk of SolarStock USA, the first live-inventory solar module platform in the United States, operated by Yulz Design LLC. SolarStock USA holds Tier 1 manufacturers' module inventory in U.S. warehouses in California, Georgia, New Jersey and Texas, with brands including Sunpro Power, JA Solar, Mission Solar, Waaree and ZN Shine. Research outputs reflect the desk's independent analytical view; they are not investment advice and do not constitute a solicitation.
13.5 About the Authors
Yuliani Llohis is the Founder and Chief Executive Officer of SolarStock USA. Previously, she built and led Zytech Solar USA — the US subsidiary of Spanish PV manufacturer Zytech Solar Group — for fifteen years, with full P&L responsibility for the American market across residential, commercial, and utility-scale segments. The SolarStock USA Research Desk synthesizes primary regulatory sources, third-party market data and manufacturer documentation into published research.
13.6 Disclaimer
13.7 Contact
solarstockusa.com · sales@solarstockusa.com · +1 (619) 638-5178
13.8 Republication
This guide may be quoted or excerpted with attribution to "SolarStock USA Research, US Solar Module Efficiency Benchmark 2026 (Q4 2026 Edition)". Charts may be reproduced with their source captions intact. Third-party data remain subject to their publishers' terms. Republication of the full document requires written permission from SolarStock USA.